
Tube Matching and Open vs Closed Loop Amplifiers
- Mar 13, 2021
- 6 min read
Updated: Mar 13, 2021
Vacuum tube testing can be extremely important for the performance of an audio system. While vacuum tube testing is important in circuits requiring balanced operation (push-pull output stages or differential stages) is often overlooked in open loop or very mild feedback amplifiers such as the popular Class-A SET amps.
However rather than matching tubes for a specific amplifier stage, tubes in open loop amplifiers MUST be matched between stereo channels to insure that the gain, noise and phase characteristics between channels are identical
The mechanism that makes this so is negative feedback… or lack thereof in open loop amplifiers and preamps
1. What is Negative Feedback
Negative feedback is method of improving performance of a system by measuring or sampling the output and making corrective adjustment to the input such that the output is closer to the desired target.
By sampling the output and taking corrective action, negative feedback or a closed loop in most amplifiers is used to reduce output impedance, increase bandwidth and help linearize the amplifier.
Linearizing the amplifier is not only a reduction in distortion and noise but it makes the amplifiers overall performance less susceptible to variance in electrical properties cause by manufacturing and device tolerances. In the case of tubes amps, the vacuum tubes always have a large potential for electrical performance variation.

Figure 1 shows the block diagram view of a basic feedback system.
· Ao Open loop amplifier gain
· β Feedback factor (usually less than 1)
· Af Closed loop gain of the system
β (beta) is a sampling of the output signal expressed as a factor ≤ 1. It describes the ratio of the sampled signal from the output. Since this is a discussion on negative feedback rather than positive feedback, β is subtracted from the input signal and makes the effective input signal smaller. This is why negative feedback also reduces overall amplifier gain.
For example:
· β = 1, the full amplitude of output signal is fed back and subtracted from the input of the amplifier.
· β = 0.5, only half of the output would be subtracted from the input.
· β = 0 no signal is sampled from the output and the gain of the amplifier is equal to Ao. Therefore, Ao = Af. This is the case for an open loop amplifier.
By analyzing the loop in Figure 1, the characteristic feedback gain equation can be found:

From equation 1, we can see that without feedback (where β=0), Af = A0 ÷ 1. More simply, the amplifier gain is equal to Ao which is the open loop gain of the amplifier.

2. Feedback Example
Let’s put this feedback equation to work! To start I will use some of the design specifications from our 288 amplifier.
The 288 Mono Amplifier offers 22dB of closed loop gain (Af) and 15dB of negative feedback. This means that with feedback applied as normal, the gain of the amplifier is 15dB less than if the amplifier ran open loop. Therefore, the open loop gain of the amplifier (Ao) would be 22dB + 15dB = 37dB.
Ao = 37dB
Af = 22dB


Using Equation 3, we can convert Ao and Af from dB to the scalar form for gain.
Ao = 70.8
Af = 12.6
Now we have one more step, find β. We can do this by rearranging Equation 1 and some simple algebra as shown below in Equation 4.

Plugging in Ao = 70.8 and Af = 12.6, we find:
β=0.065.
We have found the feedback factor for the 288 amplifier!
3. Reduction in Gain Variation
Let’s assume that in our 288 amplifier, we replace all of the vacuum tubes. These new tubes cause a 15% increase in the Ao gain of the amplifier due to variance in their electrical properties.
Using the values fund in Section 2, the new open loop gain is Ao = 70.8 x 115% = 81.4
In section 2 we have also found that the feedback factor β for our 288 amplifier is equal to 0.065. Using Equation 1, we can figure out how much the 15% change in vacuum performance has effected the closed loop gain of the amplifier.

The new closed loop gain is 12.9 compared to 12.6 from before. This is only a 2.3% change in the gain!
Through the use of negative feedback, a 15% change in vacuum tube performance only translated to a 2.3% change in overall closed loop amplifier performance!
The results found above illustrate exactly why vacuum tube matching between stereo channels in a feedback amplifier is usually noncritical.
However, as the feedback factor β is reduced, the change in gain will approach the full 15% variation caused by the vacuum tubes.
This would be the case for a feedback free open loop amplifier since the gain is equal to Ao as illustrated in Figure 2.
4. Tube Matching
So far we have made the argument as to why matching tubes in open loop amplifiers are critical for channel-to-channel performance. It is also well known that matching tubes in balanced amplifier circuits within a channel is key for good performance.
So what does it mean to have matched tubes?
Matched tubes means that the electrical performance between tubes or tube sections are identical. This insures that when used in a circuit, the final circuit performance will be as predictable as possible.
The 4 key electrical tube properties for a triode are:
Gm: transconductance
u (mu): amplification factor
Ra: plate resistance
Ia: plate current
Since these parameters are dynamic and change with the specific operating point used in circuit, it is key to match these parameters at the operating point to be used in circuit.
Another method is to match tubes by sweeping their characteristics for all possible points of operation. This is called curve trancing and usually gives the most accurate view into a tubes health and performance rather than a static pinpoint measurement.
4.1 Tube Curve Tracing
Our 22A3 amplifier uses a parallel 6SL7 tube for the first stage. The 6SL7 is a twin triode with two identical tube sections in a single package or envelope. In this amplifier, these sections are used in parallel rather than independently. Therefore, measuring and matching tubes for balanced sections is not critical. Instead, since the 22A3 is an open loop amplifier, we in house test and match tubes into batches of 2 for stereo channels. During our testing, the two sections of the 6SL7 are paralleled to match the in use circuit.
To illustrate the importance of tube testing and matching, we tested a new production Tung-Sol 6SL7GT and new old stock NOS Sylvania 6SL7WGT with sections in parallel.


Figure 3: Tung-Sol 6SN7GT (left) Sylvania 6SN7WGT (right)
The tubes were curve traced with both 250V and 150V on the plates while sweeping the grid voltage. The plate current (Ia) was then monitored and plotted against the control grid voltage. This type of plot shows the instantaneous transconductance of the tube.
The curves between the tubes were overlaid with the Tung-sol in the dotted line and the Sylvania plotted in a solid line:
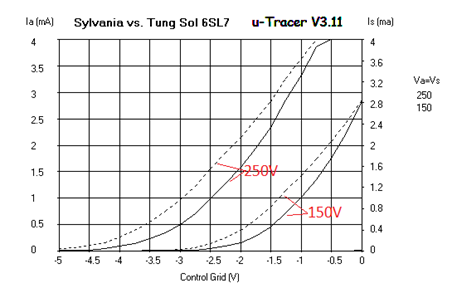
From the curve trace it is clear to see that the Sylvania tube is weaker since the current (y-axis) is much lower for a given control grid voltage (x-axis). This type of variation is common between tubes.
However, the curve trace also points out a problem with the Sylvania tube:
The Tung-sol curve is a relatively straight line above -3V for the 250V curve and -1.5V for the 150V curve. This is how these curves should look.
In contrast notice that the Sylvania tube has a constant bow to the shape of the curve. It never flattens out. At the far right where Control Grid = 0V, the current is mostly restored and nearly matches the current Tung-Sol tube! This is not how these curves should look and suggests that this Sylvania tube is very non-linear! This tube has issues with transconductance and must be discarded.
4.2 Static Measurements
If we were to test and match these tubes only at one operating point rather than curve tracing, as expected we would find that the Sylvania tube is weaker. Figure 5 below shows a snapshot of the tube performance for parameters Gm, u, Rp, and Ia for only a specific operating point. This mimics the conditions used for most tube testers.
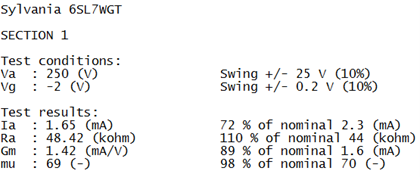
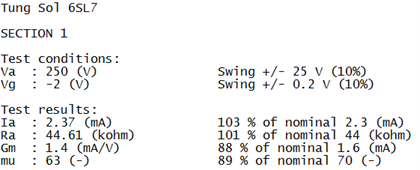
Figure 5: 6SL7 Static Performance Sylvania (top) Tung-Sol (bottom)
Note: For this test in Figure 5, only one section of the 6SL7 was tested for each tube. They were not tested in parallel as curve traced above. This has no bearing on the end conclusion
Based on the static test in Figure 5, Ia, Gm, and u (mu) are lower for the Sylvania tube which again, is the expected result based on the curve trace. Ra is larger which also indicates that the Sylvania is the weaker tube. However, based on this test alone, we would have overlooked that the Sylvania tube actually has an issue with transconductance over the entire usable range of the tube and would have tried to find a suitable match.
This is what makes curve tracing so powerful. If you know what you are looking for, it is easy to spot issues with vacuum tubes.
For Bandwidth Audio amplifiers, tubes are curve traced to first weed out bad tubes and second, find suitable matches. Then static measurements are used at the operating point in the amplifier to confirm that the tube match is good. Typically, we can match all 4 performance parameters to 5% for both a tube-to-tube match or multi-section match within a single tube.
This ensures our amplifiers have the best possible performance.


Comments